USDA Hardiness Zone Map: A Complete Guide to Planting Zones and Gardening
The USDA Hardiness Zone Map is an essential tool for gardeners, homeowners, landscapers, and plant enthusiasts who want to choose plants suited to their local climate. It helps people understand which perennial plants, shrubs, trees, and flowers are most likely to survive winter temperatures in a particular area. By identifying the average annual extreme minimum winter temperature, the map provides a useful starting point for planning a healthy and successful garden.
Whether you are growing flowers, planting fruit trees, designing a landscape, or starting a vegetable garden, understanding your hardiness zone can help you make better decisions. However, the map is only one part of successful gardening. Soil quality, sunlight, rainfall, humidity, and local weather conditions also influence how well plants grow.
This guide explains what the USDA Hardiness Zone Map is, how it works, how to find your zone, and how to use it to select suitable plants.
What Is the USDA Hardiness Zone Map?
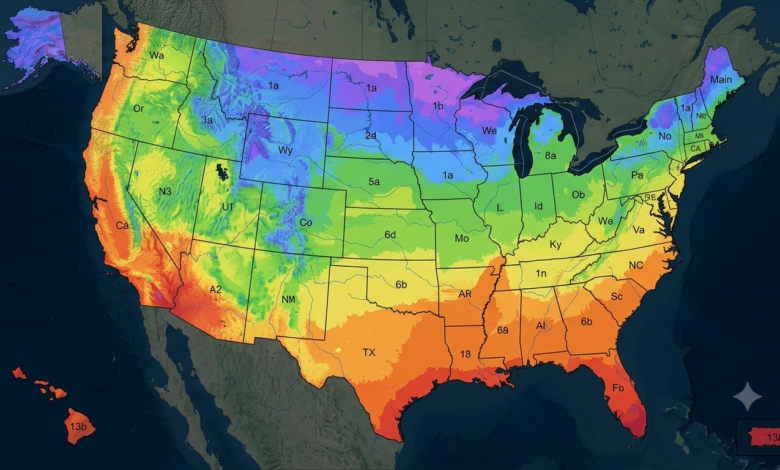
The USDA Hardiness Zone Map is a climate-based guide developed by the United States Department of Agriculture (USDA). It divides the United States and certain territories into numbered planting zones based on average annual extreme minimum winter temperatures. These zones help gardeners estimate whether perennial plants can withstand the coldest temperatures typically experienced in their location.
The map uses 13 main zones, numbered from Zone 1 to Zone 13. Each main zone represents a 10°F temperature range, and most zones are divided into two smaller sections, designated a and b, representing 5°F differences. Lower-numbered zones experience colder winter temperatures, while higher-numbered zones generally experience milder winters.
For example, a plant recommended for Zone 5 may tolerate colder winters than a plant suited only to Zone 9. Checking a plant’s recommended hardiness range before purchasing it can reduce the risk of winter damage and help you choose varieties that are more likely to survive for several years.
The map is especially useful for perennial plants because these plants are expected to survive and grow again over multiple seasons. Annual flowers and vegetables, which typically complete their life cycle within one growing season, require additional planning based on frost dates and seasonal temperatures.
How to Find Your USDA Hardiness Zone
Finding your planting zone is straightforward with the official interactive USDA map. The current official edition is the 2023 USDA Plant Hardiness Zone Map, which uses weather data collected from 1991 through 2020.
Follow these steps to identify your zone:
- Visit the official USDA Plant Hardiness Zone Map.
- Enter your U.S. ZIP code into the map’s search tool, if available.
- Alternatively, zoom in and click your location on the interactive map.
- Check the displayed zone, including its letter designation, such as 6a, 7b, or 9a.
- Compare the zone with the hardiness range listed on plant labels, nursery websites, or seed catalogs.
For example, if your location falls in Zone 7b, you can use that information to identify perennial plants rated for Zone 7b or a broader range that includes it. Plants rated for colder zones may also survive in your garden, provided their other growing requirements are met.
Remember that a ZIP code may cover different local conditions. When possible, examine the precise location on the interactive map instead of relying only on a broad regional description.
Understanding USDA Hardiness Zones 1–13
The USDA Hardiness Zone Map uses temperature ranges to classify winter conditions across the United States. Each zone covers a 10°F range, while the a and b subdivisions separate the range into 5°F increments. The following examples explain how the system works.
| Hardiness zone | Average annual extreme minimum temperature | General climate description |
|---|---|---|
| Zones 1–2 | Approximately −60°F to −40°F | Extremely cold winters |
| Zones 3–4 | Approximately −40°F to −20°F | Very cold winters |
| Zones 5–6 | Approximately −20°F to 0°F | Cold winters |
| Zones 7–8 | Approximately 0°F to 20°F | Moderate winter conditions |
| Zones 9–10 | Approximately 20°F to 40°F | Mild winters |
| Zones 11–13 | Approximately 40°F to 70°F | Very warm winter conditions |
These are broad temperature groupings, not guarantees about the weather in a particular year. The full zone system provides more precise half-zone categories for gardeners who need to compare plants with specific cold-tolerance requirements.
A location in Zone 3, for example, generally needs plants that can withstand much colder winter temperatures than a location in Zone 10. However, a plant’s ability to tolerate cold does not automatically mean it will tolerate summer heat, drought, heavy rainfall, or unsuitable soil.
Why the USDA Hardiness Zone Map Matters for Gardeners
The USDA Hardiness Zone Map helps gardeners make informed planting decisions before investing time and money in their gardens. Choosing plants that are poorly suited to local winter conditions can result in damaged roots, dead branches, or the loss of an entire perennial plant.
Plant selection is one of the map’s most important uses. Gardeners can check the recommended hardiness range for roses, hydrangeas, lavender, ornamental grasses, fruit trees, and other perennial plants before buying them. Selecting varieties suited to the local zone improves the chances that they will survive winter and return in the following growing season.
The map also supports landscape planning. Homeowners can use it when choosing trees for shade, shrubs for privacy, and perennial flowers for borders. Garden designers can compare the cold tolerance of different plants and create landscapes that require fewer replacements after harsh winters.
For fruit growers, hardiness information is useful when selecting apple trees, berry bushes, and other perennial crops. However, fruit production also depends on factors such as chill hours, pollination, bloom timing, and the risk of spring frost. A tree may survive winter in a particular zone without producing a reliable harvest there.
Finally, the map can help gardeners interpret plant labels and nursery recommendations. Rather than selecting plants based only on appearance, shoppers can consider whether a plant is likely to survive the winter in their area.
How to Choose Plants Using the USDA Hardiness Zone Map
Once you know your hardiness zone, the next step is to select plants that match your garden’s winter conditions. Most plant labels and nursery listings include a recommended hardiness range. Look for a range that includes your zone, especially if you are purchasing expensive trees, shrubs, or long-lived perennials.
For example, a plant rated for Zones 5–8 is generally considered suitable for locations within that range. If your garden is in Zone 6, that plant may be a good candidate, assuming its soil, sunlight, moisture, and other requirements are satisfied. If you live in Zone 4, the same plant may face a greater risk of winter injury.
Consider the following factors when selecting plants:
- Hardiness rating: Check the lowest zone recommended for the plant.
- Sunlight requirements: Determine whether it needs full sun, partial shade, or shade.
- Soil conditions: Check drainage, soil texture, and pH requirements.
- Water needs: Select plants suited to your rainfall and irrigation conditions.
- Local climate: Consider wind exposure, humidity, summer heat, and spring frost.
It is also wise to consult local university extension services or experienced nurseries. They can recommend plant varieties that have performed well under local conditions.
Limitations of the USDA Hardiness Zone Map
Although the USDA Hardiness Zone Map is valuable, it does not predict every factor that influences plant survival. Its primary purpose is to describe average annual extreme minimum winter temperatures, not to provide a complete picture of a region’s climate.
For example, two gardens in the same zone may experience very different growing conditions. One may have well-drained soil and shelter from strong winds, while the other may have waterlogged ground and frequent exposure to cold air. These differences can affect plant health even when both gardens share the same hardiness rating.
The map also does not tell you the exact date of the last spring frost or the first autumn frost. Gardeners growing tomatoes, peppers, cucumbers, and other seasonal crops should use local frost-date information and soil-temperature guidance to determine when to plant.
Other important limitations include:
- Summer heat: Some plants tolerate winter cold but struggle in very hot summers.
- Drought: Hardiness zones do not measure how much rain an area receives.
- Humidity: Moisture in the air can influence plant diseases and cold damage.
- Microclimates: Walls, slopes, valleys, and paved surfaces can create warmer or colder pockets.
- Unexpected weather: A rare cold snap may damage plants that normally survive in the area.
The USDA recommends using the map as a general guide rather than a guarantee. A plant’s overall health, growing environment, and exposure to unusual weather all matter.

USDA Plant Hardiness Zone Map
What Is the Difference Between the 2012 and 2023 USDA Hardiness Zone Maps?
The 2023 USDA Plant Hardiness Zone Map is the latest official edition identified on the USDA’s website. It replaced the 2012 edition and uses updated climate data from 1991–2020. The updated map also offers detailed geographic information to help users identify local hardiness zones.
Some locations shifted to a warmer half-zone in the 2023 edition, while other areas experienced different changes or remained in the same zone. Such changes reflect differences in the underlying temperature data and mapping methods; they do not mean every winter will be warmer or that cold weather will no longer occur.
If your area changed zones, you do not necessarily need to replace plants that are already growing successfully. Instead, use the updated information when making future planting decisions, especially when selecting plants near the limits of their cold tolerance.
Gardeners can compare the official USDA map and downloadable maps to review current zones and changes from the earlier edition.
Common Mistakes to Avoid When Using the USDA Hardiness Zone Map
One common mistake is assuming that a plant will thrive simply because its hardiness rating matches the local zone. Hardiness indicates potential winter survival, not guaranteed growth, flowering, or fruit production.
Another mistake is confusing hardiness zones with planting calendars. The USDA map does not specify the best date to sow seeds or transplant seedlings. Those decisions depend on local frost dates, the crop’s temperature requirements, and the length of the growing season.
Gardeners should also avoid ignoring microclimates. A sheltered garden near a building may be warmer than an exposed garden nearby. Conversely, low-lying areas may collect cold air and experience more frost damage.
To get the most from the USDA Hardiness Zone Map, combine it with local gardening advice, soil testing, weather forecasts, and information about each plant’s growing requirements. This approach provides a more complete picture than relying on the zone number alone.
Frequently Asked Questions
1. What is the USDA Hardiness Zone Map used for?
It helps gardeners identify plants that are likely to survive typical winter minimum temperatures in a particular location. It is especially useful for selecting perennial flowers, trees, shrubs, and fruit plants.
2. How do I find my USDA hardiness zone?
Visit the official USDA Plant Hardiness Zone Map website, enter your U.S. ZIP code, or select your location on the interactive map. Check the displayed zone and its a or b designation.
3. What is the latest USDA Hardiness Zone Map?
The official USDA website provides the 2023 Plant Hardiness Zone Map, based on average annual extreme minimum winter temperatures recorded over the 1991–2020 period.
4. Does a higher hardiness zone mean warmer winters?
Generally, yes. Higher-numbered zones have higher average annual extreme minimum winter temperatures, while lower-numbered zones experience colder winter extremes.
5. Can I grow plants outside my hardiness zone?
Sometimes. Containers that can be moved indoors, protected planting locations, winter mulching, and suitable shelter may help some plants survive. However, these measures cannot guarantee success, particularly during severe cold.
6. Does the USDA map tell me when to plant vegetables?
No. The map focuses on winter cold tolerance, particularly for perennial plants. For vegetables, use frost-date calendars, soil temperatures, and crop-specific planting recommendations.
Conclusion
The USDA Hardiness Zone Map is a practical starting point for choosing plants that can withstand the winter conditions in your area. By identifying your zone and comparing it with plant hardiness ratings, you can make better decisions about flowers, shrubs, trees, and perennial crops.
However, successful gardening requires more than knowing a zone number. Sunlight, soil drainage, rainfall, summer heat, frost timing, and local microclimates all influence plant growth. Combine the official USDA map with local gardening knowledge to create a garden that is both attractive and resilient.
For the most accurate information, use the official USDA Plant Hardiness Zone Map before selecting plants for your next gardening project.